Oil and Gas News and Energy on July 23, 2026: Brent Above $94 Amid Strait of Hormuz Blockade, TTF Gas Exceeds €60/MWh, OPEC+ Quotas for August, Stabilization of the Russian Fuel Market, LNG, Refineries, Electricity, Renewables, and Coal. An Overview for Investors and Market Participants in the Fuel and Energy Sector
The global fuel and energy market is entering late July 2026 in a state not seen by traders since spring: the geopolitical risk premium has fully returned to the pricing models. The escalation of the U.S.-Iran conflict, the effective halt of shipping through the Strait of Hormuz, and the maritime embargo imposed by Houthi forces against Saudi Arabia have pushed Brent crude oil above $94 per barrel—a peak not reached in six weeks. European gas at the TTF hub has surpassed €60 per MWh for the first time since March, while injection into underground storage is lagging behind last year’s schedule. Against this backdrop, OPEC+ continues its cautious approach to increasing quotas, the Russian fuel market is gradually emerging from acute gasoline shortages, and the global energy transition is facing a new reality: expensive LNG is bringing coal back into Asia's energy balance. Below is a detailed overview of key events in the oil, gas, electricity, coal, and raw materials markets for investors and participants in the fuel and energy sector.
Oil Market: Geopolitical Premium Returns to Pricing
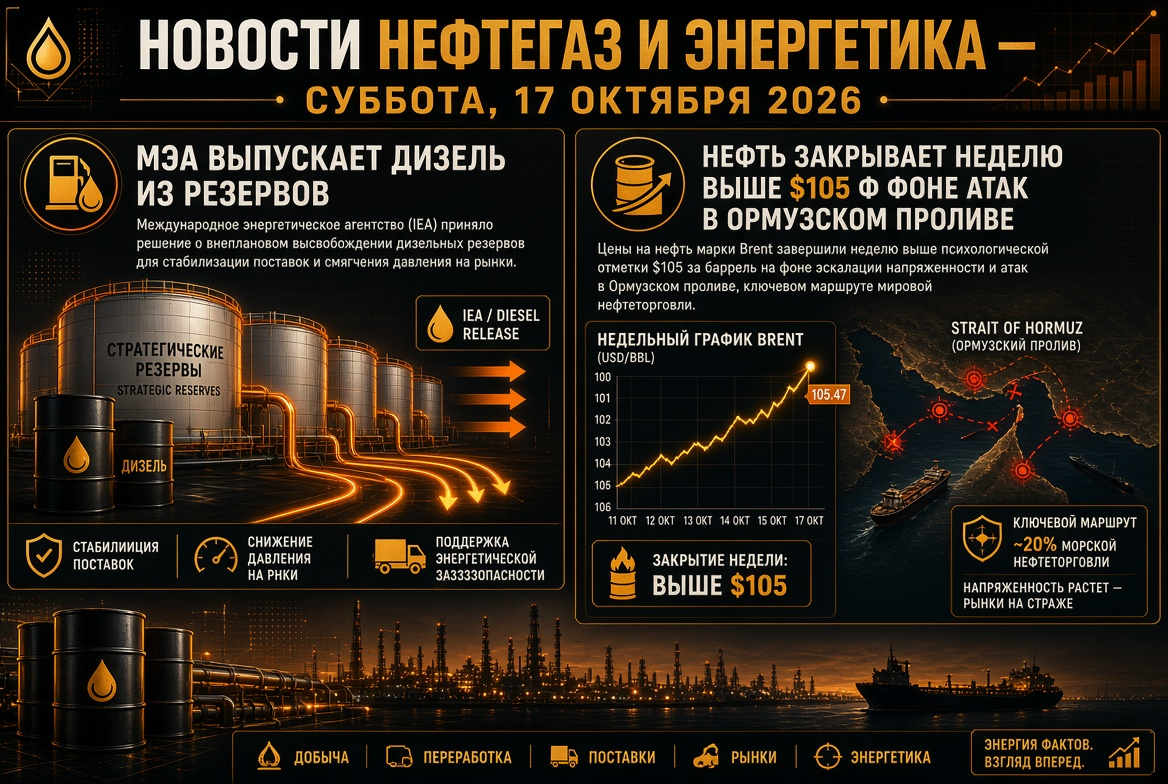
Oil prices are experiencing the most aggressive upward movement seen since the beginning of summer. During trading on July 22, the price of September futures for Brent crude at the London ICE surged over 3%, reaching $94.14 per barrel—its highest since June 11. American WTI similarly rose more than 3%, climbing towards $87 per barrel. For comparison, just on July 2, Brent was trading below $71, and in mid-June at around $80.5. Thus, in three weeks, the market has recouped over 30% of its value.
The drivers of the current oil rally include:
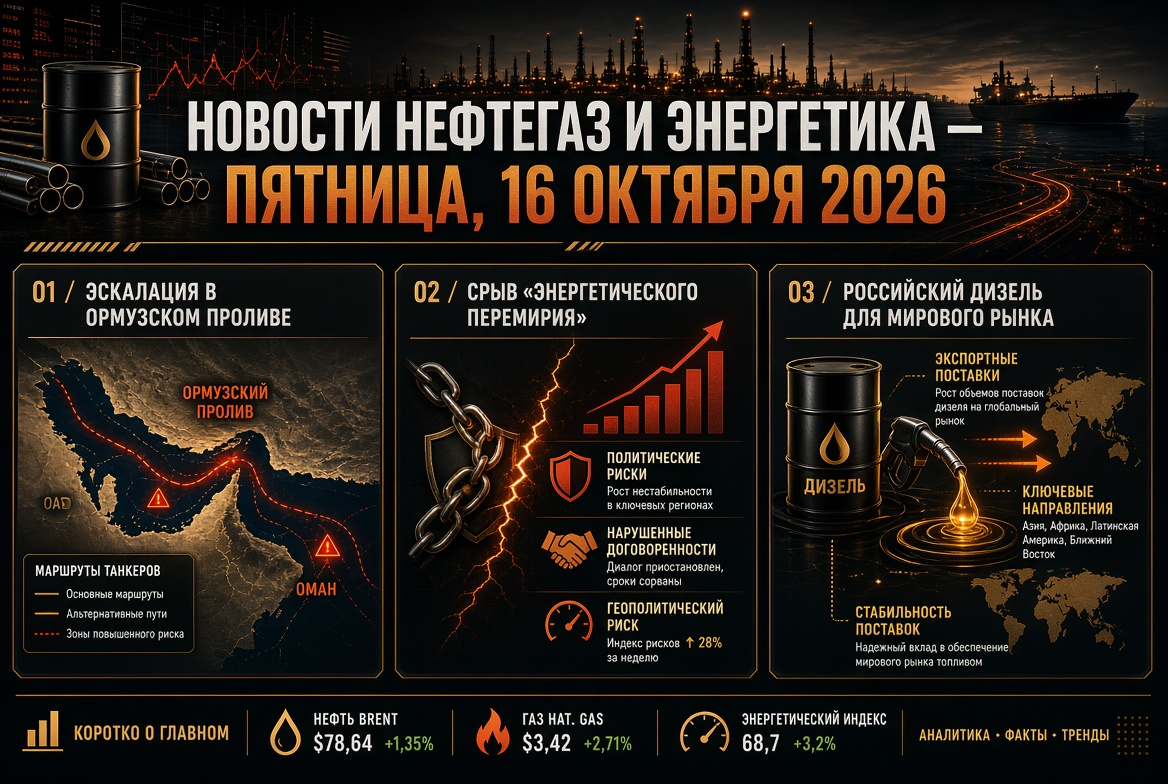
- Strait of Hormuz Blockade. According to shipping traffic data, there were days last week when not a single vessel crossed the Strait, through which about one-fifth of global marine oil trade and a significant share of LNG pass.
- Direct Attacks on Tanker Fleet. Incidents of fires and immobilization of oil tankers were recorded while attempting to take the southern route, as well as a case where the crew was forced to abandon the vessel.
- Maritime Embargo by Houthi Forces. Yemeni forces announced a blockade of supplies from Saudi Arabia, threatening export flows from the largest OPEC producer.
- Expanding Front. The U.S. is increasing its military presence in the region by deploying additional aircraft to bases in Israel; the market is factoring in the risk of Washington's full-scale involvement in the conflict.
- Declining Inventories. The IEA reports a decrease in global commercial oil inventories, which enhances price sensitivity to any supply disruptions.
What This Means for Investors
The widening Brent–WTI spread to $7–9 per barrel is a classic indicator that the market is assessing the risk of disruption specifically to Middle Eastern logistics, rather than a global supply shortage as such. For oil companies with diversified resource bases outside the Persian Gulf, this means a temporary expansion of margins. For oil traders and fuel companies, there is a sharp rise in freight and insurance rates, which are already consuming some of the price gains.
OPEC+: Cautious Quota Increases Instead of a Price War
The OPEC+ alliance maintains a conservative stance. Following a videoconference on July 5, seven countries voluntarily reducing production beyond the overall quotas—Saudi Arabia, Russia, Iraq, Kuwait, Kazakhstan, Algeria, and Oman—agreed to increase quotas for August by 188,000 barrels per day. The total quota for the alliance for August will be 36.019 million b/d. Saudi Arabia and Russia will each receive an increase of 62,000 b/d.
Key parameters of the deal so far:
- From February to August 2026, the cumulative quota has increased by approximately 940,000 b/d—a volume comparable to the production of a mid-sized participant country.
- The "Seven" is returning to the market restrictions totaling 1.65 million b/d, taking into account the UAE's departure from the alliance in May due to dissatisfaction with the distribution of quotas.
- For a complete end to voluntary restrictions, September quotas will also need to be raised by 188,000 b/d. The next meeting is scheduled for August 2.
- Iraq has publicly indicated it may exit the agreement if its production limit is not raised—a factor of the alliance's internal fragility.
The OPEC+ dilemma for the second half of the year is apparent: analysts predict a return to a structural surplus following the normalization of the situation in the Persian Gulf. The alliance will have to choose between restraining production for the sake of price and battling for market share. For now, the current geopolitical premium masks this choice.
Gas Market: Europe Pays a Premium and Lags Behind Storage Injection Schedule
The European gas market finds itself under double pressure. Prices at the Dutch TTF hub surpassed €60 per MWh on July 20 for the first time since mid-March, adjusting to €59 by Tuesday. In dollar terms, the price approached $700 per thousand cubic meters. Since the beginning of July, the European gas benchmark has risen approximately 35%, while the Asian JKM Platts index rose about 25%.
The main issue for the European Union is not so much the price as the rate of underground gas storage filling:
- The 2025–2026 heating season ended with extremely low reserves: as of April 1, the storage facilities were filled to 27.66%—13.4 percentage points below the average of the previous five years.
- By July 19, the fill level reached only 53.7%, which is 15.7 percentage points below the five-year average. The gap is not narrowing but rather widening.
- Daily injections in July decreased to 270 million cubic meters compared to 308 million in June. A year ago in mid-summer, daily replenishment averaged 338 million cubic meters—25% more.
- The competition for LNG cargoes is shifting towards Asia, where liquefied gas is needed for current consumption rather than for replenishing reserves.
Risk Scenarios for Autumn
Industry experts do not expect a repeat of the 2022–2023 peaks, but they do anticipate that, if the conflict in the Persian Gulf remains unresolved, prices could exceed $1000 per thousand cubic meters. An additional risk factor is the predicted El Niño peak in December, which could alter the heating season profile. For the European industry, energy sector, and fertilizer producers, this means a need for hedging now.
LNG: Record Wave of New Capacities on the Horizon for 2026–2028
Despite the current tensions, the mid-term picture for the liquefied natural gas market looks fundamentally different. According to IEA estimates, the global LNG market is expected to see its largest capacity growth in history between 2026 and 2028. Projects are being prepared for launch in the U.S., Qatar, Canada, and several other jurisdictions. Investments in LNG infrastructure are on a stable upward trajectory—unlike investments in oil extraction, which have recorded the first annual decline since 2020 of approximately 6%, primarily due to reduced spending in the U.S. shale industry.
The practical takeaway for market participants is that the current price spike is primarily logistical and geopolitical in nature. Structurally, the gas market is moving towards a surplus by the second half of the decade, creating an asymmetry between spot prices and long-term contract expectations.
Gas Demand: IEA Predicts Decline in 2026
The International Energy Agency has revised its forecast for global natural gas demand downwards. The regional picture has been mixed:
- Asia: Demand is expected to decrease by approximately 0.5%. Expensive LNG is prompting a shift back to coal generation and dampening activity in energy-intensive industries.
- The Middle East: The sharpest decline is anticipated—around 4%—due to the direct impact of the conflict on infrastructure and production.
- Eurasia: Growth is projected at approximately 3%.
- Central and South America: An increase of around 3% is expected amid declining hydroelectric generation.
The price elasticity of gas demand has proven to be higher than anticipated: with high prices, consumers in developing economies are quickly reverting to coal. This is a key factor limiting the ceiling on gas prices even amid geopolitical stress.
Russian Oil Products Market: Emergence from Acute Fuel Crisis
The domestic oil products market in Russia is going through one of its most challenging periods in recent years. The reason is a reduction in primary processing: in June and July, the operation of several major plants, including the Omsk and Saratov refineries, as well as the NORSI complex, was halted or restricted amid infrastructure damage and unscheduled shutdowns.
Consequences for the fuel market include:
- Wholesale exchange prices for diesel fuel at the St. Petersburg International Commodity Exchange have exceeded historical highs, with trading volumes for AI-95 dropping by up to 43% during certain periods.
- A number of regions implemented restrictive mechanisms for fuel sales, including an odd-even scheme; in resort regions of the Krasnodar Territory, Crimea, and the Caucasus, seasonal demand exacerbated the imbalance.
- Retail prices at major gas station chains were held within inflation limits, while independent stations saw prices rise significantly higher.
Regulatory Measures and Early Signs of Stabilization
- Export Ban: The export of gasoline and diesel fuel is prohibited until July 31, with discussions ongoing about extending the ban.
- Regulation of Exchange Sales: The mandatory share of sales through the exchange has been reduced from 15% to 10% to improve flexibility in direct supplies.
- Import Substitution: Belarus redirected volumes of gasoline to the Russian market—between June 1 and 25, imports reached a historical maximum of 141,000 tons. Kazakhstan, processing 15–17 million tons of oil annually, is also being considered as a potential supplier.
- Resumption of Exchange Sales: Some refineries have returned to selling fuel on the exchange, with wholesale trading volumes increasing, unsatisfied demand decreasing, and the situation stabilizing at certain gas stations.
The priority to ensure the domestic market remains at the level of the relevant deputy prime minister. Official estimates suggest normalization by August as repairs at refineries are concluded. Industry experts are more cautious and allow for shifts in timelines, noting that the shortage of supply is temporary: price reductions may occur two to three months after resolving processing issues.
Electric Power and Renewables: Record Investments Amid Growing Flexibility Demands
The global electricity sector is undergoing structural transformation. Total global investments in energy have exceeded $3.3 trillion, with investments in clean technologies—renewable energy, grids, storage, and nuclear generation—doubling those in fossil fuel, which account for around $1.1 trillion. Solar photovoltaic energy is attracting more capital than any other technological direction in the fuel and energy sector. Investments in energy transition reached $2.3 trillion in 2025.
Key trends in the electrical sector include:
- Renewables and Nuclear Surpass Coal in the global generation energy balance—a turning point documented by IEA forecasts.
- Data Centers as a New Demand Driver: In North America, about 2% growth in electricity consumption is primarily driven by computing infrastructure and AI workloads.
- Asia Sets the Pace: India shows an electricity demand increase of around 6.6%—the largest contribution to global dynamics.
- Nuclear Renaissance: Over a hundred reactors in France and the U.S. ensure record levels of nuclear generation, while Japan consistently returns shut-down units to operation.
- Flexibility Shortage: The increasing share of variable generation necessitates proactive investments in energy storage systems and grid modernization—without which supply reliability declines.
Coal: Last Resort Fuel Returns to the Game
Despite the long-term trend of decarbonization, the coal market has received short-term support from the gas crisis. The mechanism is straightforward: expensive LNG in Asia makes coal generation economically preferable, as evidenced by declining regional gas demand. Developing economies in the Asia-Pacific region continue to rely on coal as a means of ensuring baseload supply and energy security.
For investors, this creates a characteristic asymmetry: coal assets demonstrate strong cash flows during energy stress periods but remain under structural pressure from climate regulations and capital costs. Major exporters—Indonesia, Australia, Russia, and South Africa—maintain the ability to quickly ramp up supplies, limiting the potential for price surges in the coal market.
Commodity Sector and Logistics: Insurance Premiums as a Hidden Tax
The transformation of transport and logistics costs deserves separate attention from market participants. The military threat in the Strait of Hormuz is being transmitted to the market through several channels:
- Freight Rates for VLCC-class tankers are rising as the number of shipowners willing to operate in the risk zone decreases.
- Insurance Premiums for war risks are being revised upward, effectively creating an additional tax on every barrel of Middle Eastern oil.
- Route Extensions and reorientation of flows increase fleet turnover times, reducing the effective supply of tonnage.
- Reassessment of Delivery Premiums in favor of producers outside the Persian Gulf—West Africa, Latin America, the North Sea.
Governments in several countries are already preparing for possible disruptions in energy resource supplies by reassessing parameters for strategic reserves. At the same time, regional intermediaries are attempting to broker a ten-day ceasefire between Washington and Tehran, which could become a foundation for new negotiations. Tehran is considering the proposal, but no final agreement has yet been reached.
Forecast and Conclusions for Fuel and Energy Market Participants
The current configuration of the global energy market is characterized by the overlay of a short-term geopolitical shock on a mid-term trend towards supply surplus. Practical guidelines include:
- Oil: The range of $85–95 for Brent barrels will remain until clarity is achieved regarding shipping operations in the Strait of Hormuz. Reaching a ceasefire agreement could quickly eliminate the $10–15 premium.
- Gas: TTF prices are expected to range between €55–65 per MWh, with a risk of moving higher in a negative autumn scenario. A key indicator to monitor is the rate of daily injections into European underground storage facilities.
- Oil Products in Russia: Gradual recovery of balance as repairs at refineries conclude; the question of extending the export ban beyond July 31 remains the main regulatory risk.
- Electric Power: The investment focus is shifting from generation to grids, storage, and flexibility sources—this is where the shortage is forming.
- Coal: Tactical support from expensive gas amid ongoing long-term structural pressure.
For investors, fuel, and oil companies, the key skill in the current environment becomes not forecasting price direction but managing volatility: revisiting hedging strategies, stress-testing logistics chains, and reassessing counterparty risks in areas of heightened military risk. The fuel and energy market has entered a phase where speed of response is more critical than the accuracy of forecasts.