News in Oil, Gas, and Energy as of July 18, 2026: Brent $84–85, Blockade of the Strait of Hormuz, Europe’s Gas Reserves 49.7% Full, TTF Gas €50.6/MWh, Greece Blocks 21st EU Sanctions Package on LNG, Crisis in Russian Oil Products Market, OPEC+, Coal and Renewables
The energy sector is entering the weekend of July 18, 2026, in a state of structural tension unlike anything seen in global energy since the 2022 crisis. The resumption of maritime blockade in the Persian Gulf has effectively paralyzed shipping through the Strait of Hormuz, with Brent oil holding in the range of $84–85 per barrel. European underground gas storage facilities are less than half full— at a historical low for mid-July. Simultaneously, Greece has blocked the 21st package of EU sanctions due to a ban on transporting Russian LNG, while the Russian fuel market experiences an acute shortage of oil products, with refining levels at their lowest since 2005. Below is a detailed overview of key events in the oil, gas, and energy sectors for investors, market participants, and fuel and oil companies.
Oil Market: Strait of Hormuz Paralyzed but Prices Hold Steady
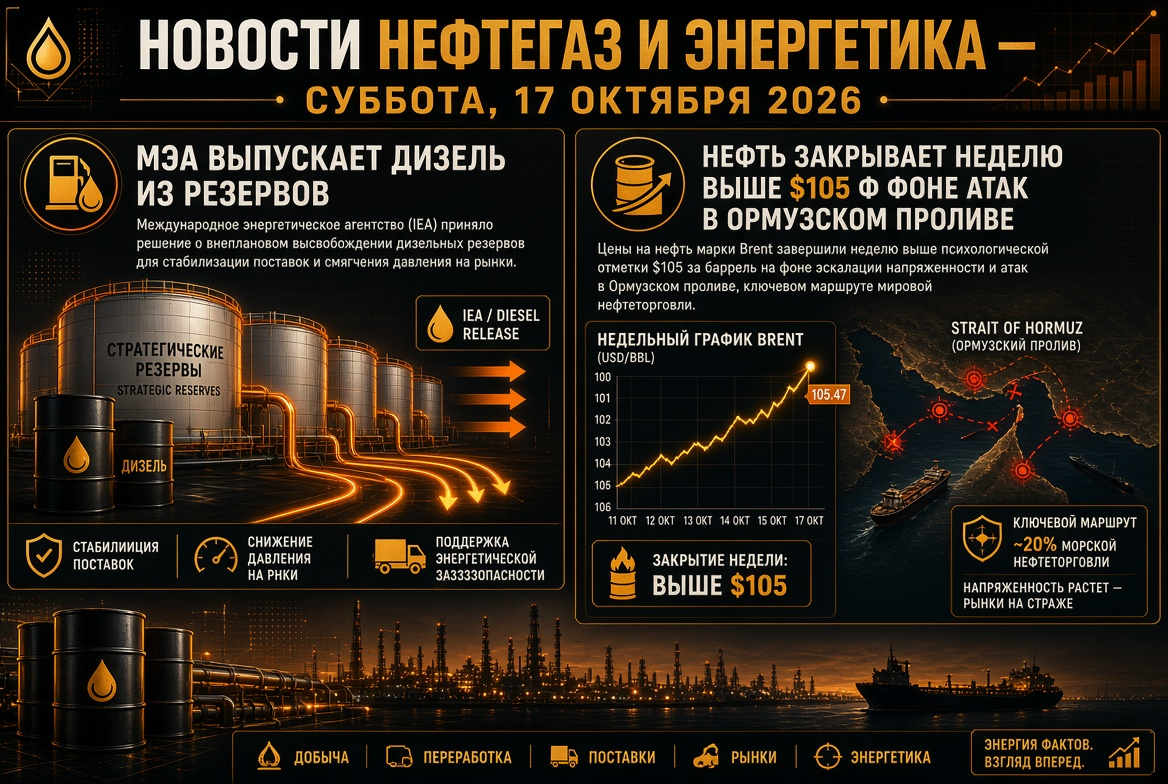
The main paradox in the current global oil market is that an unprecedented logistical shock is not being translated into a price rally. As of July 16, Brent prices hovered around $84.85 per barrel, down 0.6% from the previous session. Since the start of 2026, oil prices have increased by nearly 39%, with a 2.6% rise compared to June levels.
Key factors influencing oil price movements include:
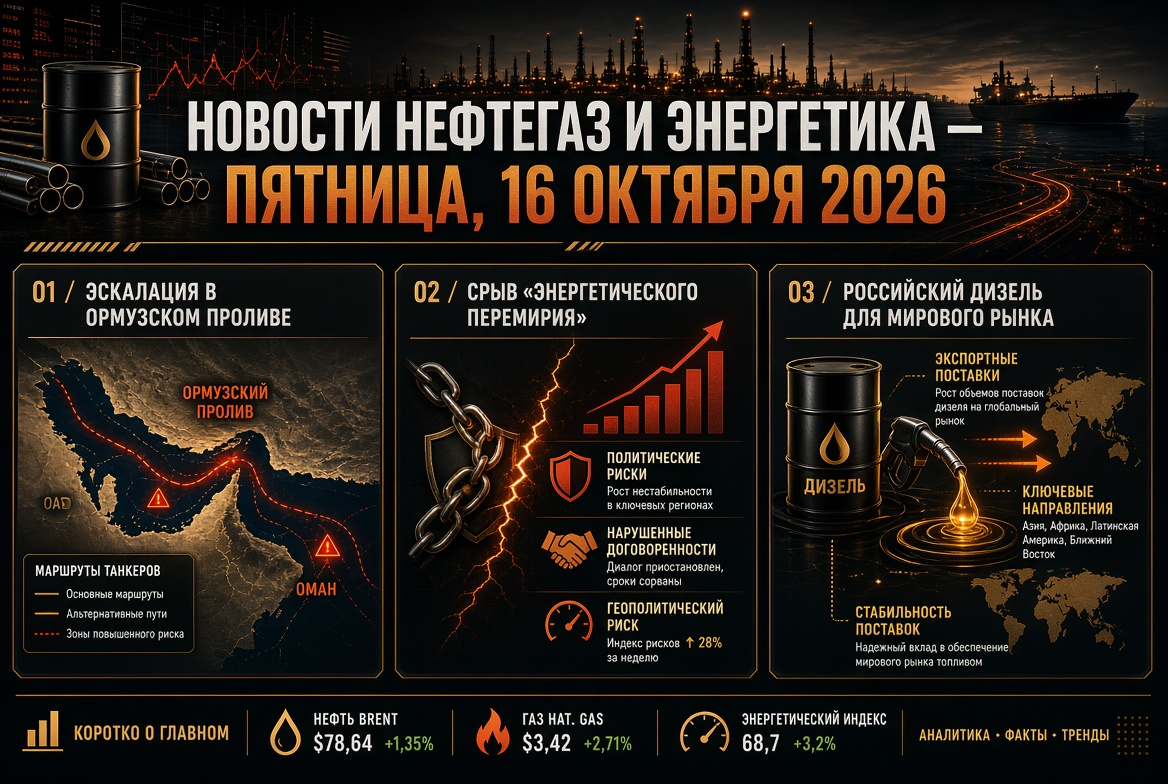
- Blockade of the Strait of Hormuz. Following new strikes on military sites in Iran and Tehran’s subsequent actions against bases in the Persian Gulf, shipping through the strait has virtually stopped. Vessels’ AIS data indicates a halt in tanker passage through Omani waters. The United States resumed its maritime blockade on ships heading to Iranian ports on July 14.
- Managed Corridor. A significant portion of analysts believes that alternating phases of escalation and de-escalation keep oil prices in the $75–90 per barrel range, with participants actively avoiding sharper fluctuations.
- Monetary Factors. The prevailing perception that the U.S. Federal Reserve is unlikely to shift to a rate cut in the near term limits expected liquidity and applies downward pressure on the entire commodity complex.
- Inventories. According to the American Petroleum Institute (API), U.S. commercial crude oil inventories decreased by only 0.564 million barrels in the reporting week compared with a consensus forecast of a reduction of 2.7 million barrels — a moderately bearish factor.
For oil companies and investors, the main takeaway is as follows: the oil market has stopped responding linearly to geopolitics. Risk premiums are already largely factored into prices, and further price increases will require not mere headlines, but confirmed physical production drops.
OPEC+ Post UAE Exit: Quotas Increase But Production Does Not
The configuration of the oil alliance has undergone fundamental changes in 2026. The United Arab Emirates exited OPEC and OPEC+ on May 1 to increase its own production, marking a significant blow to the institutional integrity of the deal in recent years.
Quotas for July 2026
- Seven key OPEC+ countries — Saudi Arabia, Russia, Iraq, Kuwait, Kazakhstan, Algeria, and Oman — have increased July's quota by 188,000 barrels per day.
- The total quota for the alliance in July is set at 35.83 million b/d without accounting for compensatory measures by quota violators.
- Russia's quota for July has been raised by 62,000 b/d—to 9.8 million b/d; a similar increase has been granted to Saudi Arabia, bringing its plan to 10.353 million b/d.
- The compensation period for exceeding production has been extended until the end of 2026.
Discrepancy Between Plan and Reality
The key narrative of the mid-2026 oil market is the colossal gap between allowed and actual production levels. In June, OPEC+ increased production by 1.18 million b/d compared to May, yet fell short of its own plan by 7.1 million b/d. The shortfall for individual countries includes:
- Saudi Arabia — minus 3.444 million b/d from quota;
- Iraq — minus 2.382 million b/d;
- Kuwait — minus 1.176 million b/d;
- Russia — minus 834,000 b/d (actual production in June fell by 61,000 b/d from May to 8.928 million b/d);
- Kazakhstan — exceeding quota by 1.152 million b/d; Oman — exceeding by 126,000 b/d.
The shortfall from Middle Eastern producers is directly linked to the regional conflict and the inability to export crude. Essentially, OPEC+ quotas have lost their function as a supply management tool: the market is balanced not by ministerial decisions but by the condition of straits and port infrastructure.
IEA and OPEC Forecasts: Demand Stable, Supply Under Question
In its July review, the International Energy Agency (IEA) takes a notably cautious view on the prospects of the oil market and has lowered its global oil supply forecast. Just a month prior, the agency anticipated that restored transit through the Strait of Hormuz would allow for a global output increase of approximately 8 million b/d in 2027, creating a notable oversupply. Revising this premise implies that a surplus scenario is being postponed.
OPEC, on the other hand, maintains a constructive outlook on demand:
- The forecast for global oil demand growth in 2027 has been raised to 1.94 million b/d from 1.73 million b/d;
- Growth expectations for the global economy remain at 3.1% in 2026 and 3.2% in 2027;
- The non-OPEC+ production forecast for 2026 has been increased by 10,000 b/d—up to 54.84 million b/d.
The long-term outlook remains inflationary for commodities: according to Russian Deputy Prime Minister Alexander Novak, global demand for oil is expected to grow at least until 2050, with the share of hard-to-recover reserves (TREC) in the structure of Russian production potentially reaching 87%.
European Gas Market: Storage Empty, Competition for LNG Intensifies
The most vulnerable segment of the global energy sector as of mid-July 2026 is European gas. The injection season started on April 1, but by mid-summer, EU underground gas storage facilities are averaging 49.7% full — an absolute minimum in recent years. At the beginning of July, this indicator was 49.22%.
Reasons for Injection Failure
- Cold Winter 2025/26 and high extraction rates from storage facilities.
- Collapse of Middle Eastern LNG. According to the IEA, liquefied natural gas production in Qatar and the UAE fell nearly 80% year-on-year from March to June due to infrastructure damage and shipping problems through the Strait of Hormuz.
- Asian Competition. In July, LNG purchases by Asian countries may reach a six-month maximum of 23.05 million tons, while European imports are expected to be only around 6.9 million tons — a two-year minimum. China, Japan, and South Korea are actively purchasing American cargoes that would otherwise have gone to Europe.
- Unfavorable Price Dynamics, which reduced traders' economic motivation for injection in the first half of the season.
Price Benchmarks
Gas at the TTF hub is trading around €50.6 per MWh. At the beginning of July, prices exceeded $535 per thousand cubic meters at €44.13 per MWh. A relatively stable scenario for the coming months suggests a range of €45–60 per MWh. However, should shipping restrictions in the Strait of Hormuz resume and Qatari exports fail to rehabilitate, prices could escalate to €60–80. An additional pressure factor is the anomalously high temperatures in Europe, which elevate electricity demand for cooling.
Sanction Landscape: Greece Blocks 21st EU Package
The EU's sanction policy is facing internal resistance. Greece opposed the 21st sanctions package, which includes a ban on European companies transporting Russian LNG to third countries. The reason cited is the protection of Dynagas, a shipping company owned by Greek businessman George Prokopiou, which operates ice-class vessels for the Yamal LNG project in Arctic conditions. Athens argues that this measure would devastate the Greek shipping industry.
Accompanying circumstances important for market participants include:
- The approval of the 21st package requires support from all 27 EU countries;
- Member states agreed to maintain the price cap on Russian oil at $44.10 per barrel until July 23 while attempts are ongoing to reach a broader agreement;
- Restrictions on the import of Russian pipeline gas have been in effect since June 17, 2026, for short-term contracts and will come into force on November 1, 2027, for long-term ones;
- In December 2025, the EU decided to accelerate the phase-out of Russian LNG, terminating long-term contracts by the end of 2026 and banning supplies under short-term contracts since April 2026;
- Greece previously submitted a roadmap to the EU for a complete refusal of Russian gas by the end of 2027 — highlighting the selective, rather than ideological, nature of the current veto.
For investors, this episode illustrates a key risk in European energy policy: with gas storage below 50% and an LNG shortage on the global market, the cost of tightening sanctions becomes significant for the EU member states themselves.
Asia: India Balances Between Import and Cost
Asian consumers remain the main center of gravity for global energy demand. The latest statistics from India demonstrate the impact of price shock:
- In May 2026, India reduced oil imports by 2% — down to 21.95 million tons compared to 22.41 million tons the previous year;
- In monetary terms, supplies increased nearly 1.7 times, reaching $18.98 billion;
- LNG imports in May grew by 3% — up to 2.236 million tons;
- In May, Russia once again became the largest oil supplier to India.
Physical volumes are stagnating, while the cost of imports rises significantly—this reflects the loss of discounts and the rising costs of logistics. Before the conflict, nearly half of India’s crude oil imports along with substantial LNG volumes came from the Gulf countries, transiting through the Strait of Hormuz. Some vessels flying the Indian flag remained blocked to the west of the strait. Pakistan officially requested Saudi Arabia in March to redirect supplies through the Yanbu port on the Red Sea.
For China, the stakes are likewise high: the country receives about one-third of its oil through Hormuz while maintaining a strategic reserve of around one billion barrels. Europe is dependent on Qatari LNG passing through the strait for 12–14%. Up to 30% of global fertilizer trade also traverses Hormuz, thereby extending the energy crisis to the agri-food sector.
Russian Oil Products Market: Refining at its Lowest Since 2005
The domestic fuel market in Russia is experiencing the most acute phase of crisis in recent years. Oil refining in the country has dropped to its lowest level since 2005 due to damages and unscheduled shutdowns of refineries amidst drone attacks. The Central Bank of Russia has separately noted the negative impact of refinery downtimes on economic dynamics.
Crisis Mechanics
- Supply Compression. Some refineries have reduced output, leading to decreased fuel volumes on exchanges, rising wholesale prices, and subsequently retail prices following suit.
- Exchange Overheating. In June, sales of AI-95 on the SPbMTSB exchange fell to 43%, while the wholesale price of diesel fuel exceeded historical highs. The supply deficit with a 2–3 week lag has transitioned to retail gas stations.
- Seasonal Peak. The vehicle season lasts from late April to October, with demand on gas stations along federal routes M-4 “Don” and M-12 “Vostok” increasing drastically.
- Panic Demand. As queues formed, drivers began filling their tanks and stocking up, further exacerbating the shortfall.
- Retail Disparities. Major networks are keeping price increases within inflationary bounds, while independent gas stations in some regions have seen prices rise significantly higher.
Regulatory Measures
- Expanding damping payments to oil companies to compensate for the difference between export and domestic prices.
- Strengthening control over wholesale sales to prevent the reorientation of supplies toward export at the expense of the domestic market.
- Monitoring exchange prices with the possibility of regulatory intervention.
- Priority support for the domestic market is the official line, confirmed by Alexander Novak's statements that oil companies are maintaining retail prices at inflation levels.
The regulator is particularly focused on diesel fuel: agricultural producers are preparing for harvest, carriers are operating at capacity, and significant diesel price increases are immediately reflected in food and transportation costs.
Budget Dimension: Russia's Oil and Gas Revenues Under Pressure
The financial performance of the industry reflects a combination of sanction, exchange rate, and production factors. The volume of Russia's oil and gas revenues in the first half of 2026 fell by 22.7% compared to the same period last year. Despite a nearly 39% rise in the dollar price of Brent since the beginning of the year, this decline indicates a combination of a strong ruble, widening damping payments, discounts on Urals, and a physical decline in refining.
Simultaneously, the industry is seeking technological solutions: Gazprom Neft has implemented equipment to enhance the efficiency of hydraulic fracturing, and the demand for gas engine fuel and technology based on it is increasing — agricultural holding companies have started to transition their fleets to gas, a direct consequence of the fuel crisis.
Electricity and Renewables: Solar Records Amidst Coal Resilience
The energy transition in 2026 continues at an accelerated pace despite hydrocarbon turbulence.
Renewable Energy
- Global solar energy production in 2025 increased by 636 TWh, exceeding the previous year's figures by 30%; according to Ember, renewables have for the first time fully satisfied the increase in global electricity demand, preventing an increase in fossil fuel generation.
- Global investments in the energy transition reached $2.3 trillion in 2025.
- The share of renewables exceeded one-third of global electricity production, surpassing coal.
- According to IEA forecasts, solar power generation will surpass nuclear power in 2026, with the share of renewables in global generation growing from 30% (2023) to 37% (2026).
- India remains the third-largest solar energy market and plans to add 200 GW of solar power plants in the next five years to achieve the target of 500 GW of renewables by 2030.
Coal and Balancing Generation
Coal retains a systemic role in the Asia-Pacific region. China has committed to controlling the growth of coal generation and gradually limiting it from 2026 to 2030; however, due to abnormal heat and peak loads on air conditioning systems, coal capacities remain a safety net for the energy system. The majority of new renewable energy capacities are still concentrated in Asia — 421.5 GW or 72% of global growth. For energy systems with a high share of solar and wind, a critical area for investment becomes energy storage systems and grid modernization.
Conclusions for Investors and Energy Market Participants
The configuration of the global energy market as of July 18, 2026, is shaped by several resilient patterns that will determine price movements in the coming weeks:
- Oil. The $75–90 per barrel range appears to be the base scenario. The key upwards trigger is not headlines about escalation but confirmed physical production drops from the Persian Gulf. The downward trigger is the restoration of transit through Hormuz, which could open the path to oversupply in 2027.
- Gas and LNG. The European market is the most vulnerable link. Storage below 50% in mid-July means any disruption in fall supply will immediately reflect in TTF quotes without a buffer. The €45–60 per MWh range is the optimistic scenario; €60–80 represents a realistic outcome if restrictions persist.
- Sanctions. The divide within the EU over the 21st package indicates that the limit of sanctions pressure is determined not by political will but by the physical availability of alternative gas volumes.
- Oil Products and Refineries. The Russian fuel market remains in a supply deficit; normalization depends on the completion of repairs and the restoration of refining, rather than regulatory measures per se.
- Renewables and Coal. The energy transition is accelerating in electricity generation but does not negate the need for balancing capacities. Investment focus is shifting to grids and storage solutions.
The overarching conclusion for fuel and oil companies, traders, and institutional investors is that the mid-2026 energy market is more about logistics than barrels. Pricing is determined not by the volume of reserves underground but by the capability to deliver raw materials through several critical geographic points. Managing risks in such conditions requires not so much precise price direction forecasting as readiness for rapid adaptation to new information.